Creating Dotplot
To create a dotplot, select the Tools ‣ Build dotplot main menu item. The Build dotplot from sequences dialog will appear:
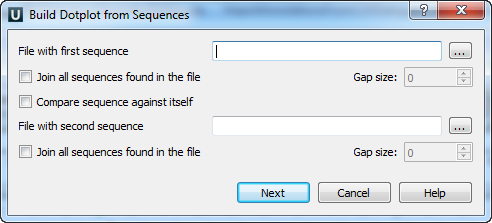
Here you should specify the File with first sequence. You should either check the Compare sequence against itself option or select the File with second sequence.
Optionally, you can choose to Join all sequences found in the file (for the first and/or second file). If you select to join the sequences, you can also specify the Gap size. The gap of the specified size will be inserted between the joined sequences.
After you press the Next button, the dialog to configure the dotplot parameters will appear:
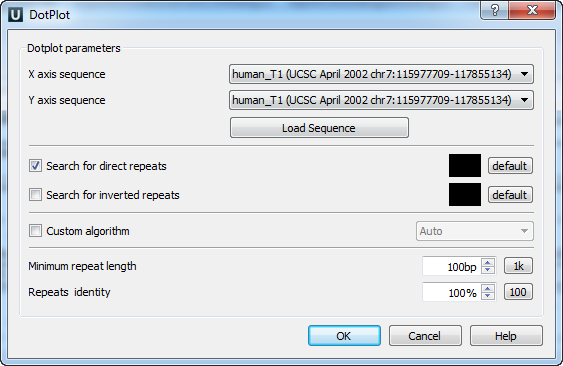
The following parameters are available:
X axis sequence — the sequence for the X dotplot axis.
Y axis sequence — the sequence for the Y dotplot axis.
If there are several sequences in the specified (the first or the second) file and you haven’t selected to join the sequences in the previous dialog, then you can select a sequence in these fields.
If you have selected to Join all sequences found in the file, then you can’t select a separate sequence from the file; the joined Sequence can be selected instead.
Search direct repeats — check this option to search for direct repeats in the specified sequences. You can also select the color with which the repeats will be displayed in the picture. The default button sets the default color.
Search inverted repeats — check this option to search for inverted repeats in the specified sequences. You can also select the color with which the repeats will be displayed in the picture. The default button sets the default color.
Custom algorithm — optionally, you can select an algorithm to calculate the repeats:
- Auto
- Suffix index
- Diagonals
The specified algorithm is provided to the Repeat Finder plugin as an input parameter. In most cases, the Auto value is appropriate.
Minimum repeat length — allows you to draw matches between the sequences that are continuous and long enough. For example, if it equals 3bp, only repeats will be found that contain 3 or more base symbols.
Press the 1k button to automatically adjust the Minimum repeat length value. A value will be set such that about 1000 repeats are found.
Repeats identity — specifies the percentage of the repeats identity.
Press the 100 button to set the 100% identity.
After the parameters are set, press the OK button. The dotplot will appear in the Sequence View:
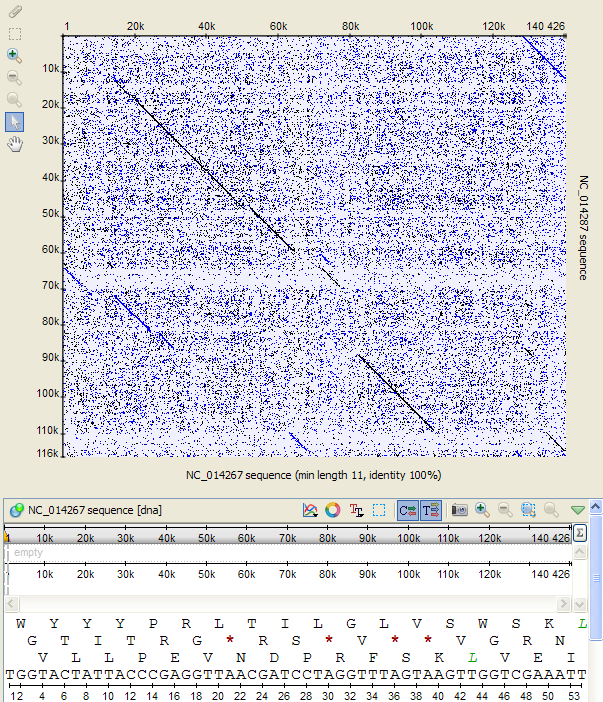
It is a two-dimensional plot consisting of dots.
Each dot on the plot corresponds to a matched base symbol at the “x” position of the horizontal sequence and the “y” position of the vertical sequence.
Visible diagonal lines indicate matches between sequences in a particular region.
See also: