Interpreting Dotplot - Identifying Matches, Mutations, Inversions, etc
Using a dotplot graphic, you can identify the following differences between the sequences:
1. Matches
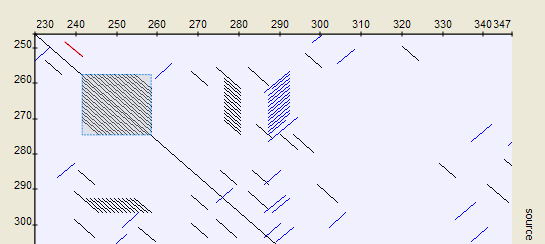
A match between sequences appears as a diagonal line on the dotplot graphic, representing a continuous match (or repeat).
2. Frame shifts
a. Mutations
Mutations are differences between sequences. On the graphic, they are represented by gaps in diagonal lines. These gaps interrupt matches.
b. Insertions
Insertions are parts of one sequence that are missing in another, while the surrounding parts match. In other words, an insertion is a subsequence that was inserted into a sequence.
Graphically, insertions are represented by gaps that lie only on one axis. A slight shift towards the other axis indicates a mutation is involved.
c. Deletions
A deletion is a subsequence that has been removed from a sequence.
A deletion from sequence A, found in sequence B, can be considered an insertion into sequence B when contained in sequence A.
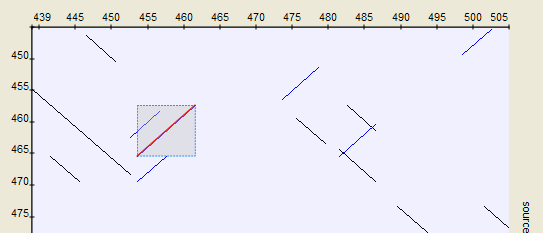
3. Inverted repeats
The Dotplot plugin also allows for the search of inverted repeats. Inverted repeats are shown as opposed to direct repeats.
Use the Search direct repeats and Search inverted repeats options in the Dotplot parameters dialog to select which repeats to depict (the dialog is described here).
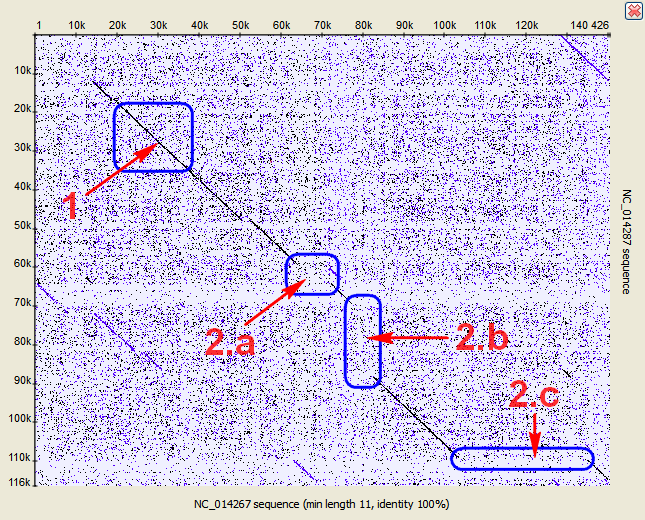
4. Low-complexity regions
A low-complexity region is characterized by redundancy in a particular part of the sequence. It is represented on a plot as a rectangular area filled with matches.
Hint
Compare a sequence with itself to easily find low-complexity regions within it.