Graph Settings
To change the settings of a graph, select the Graph -> Graph settings item in the graph context menu. The Graph Settings dialog will appear:
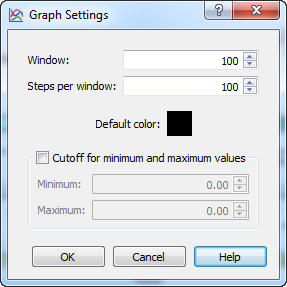
The following parameters are available:
- Window — the number of bases in a window.
- Steps per window — the number of steps in the window. The Step is calculated as Window / Steps per window.
- Default color — the default color of the graph line (or lines of graphs for GC Frame Plot).
Checking the Cutoff for minimum and maximum values checkbox enables the following settings:
- Minimum — the minimum value for the cutoff.
- Maximum — the maximum value for the cutoff.
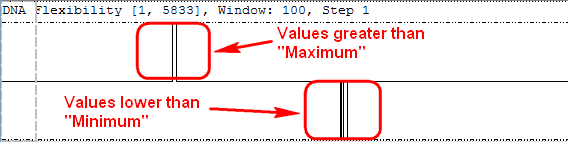
Select an appropriate minimum and maximum value and click the OK button to display the graph with cutoffs. The graph is divided into two parts. The upper part shows values greater than the specified Maximum value, while the lower part of the graph shows values lower than the specified Minimum value. For example: