ChIP-seq Analysis with Cistrome Tools
Attention! Cistrome Tools was removed in UGENE 42.0 version.
The component for ChIP-seq data analysis is not installed by default. To use this sample, add the component via the UGENE Online Installer or, if you used an offline installer, manually configure the package, see the “Configure ChIP-Seq Analysis Data” chapter of the manual (available until UGENE 39.version).
The ChIP-seq pipeline “Cistrome” integrated into UGENE allows the following analysis steps:
- Peak calling and annotating
- Motif search
- Gene ontology analysis
ChIP-seq analysis is initiated with the MACS tool. CEAS then takes peak regions and signal wiggle file to:
- Check chromosome enrichment
- Identify binding significance at features (promoters, gene bodies, etc.)
- Calculate signal aggregation at TSS/TTS or metagene bodies
Then peaks are investigated for:
- Conservation scores at binding sites
- DNA motifs at binding sites
This is based on the General ChIP-seq pipeline from Cistrome on Galaxy.
How to Use This Sample
If you haven’t used workflow samples in UGENE before, see “How to Use Sample Workflows”.
Workflow Sample Location
Available in the “NGS” section of the Workflow Designer samples.
Workflow Images
Treatment tags only analysis:
Treatment and control tags analysis:
Workflow Wizard
The wizard has 7 pages for both workflow types.
Page 1: Input data
Input files for treatment and control annotations (MACS input).
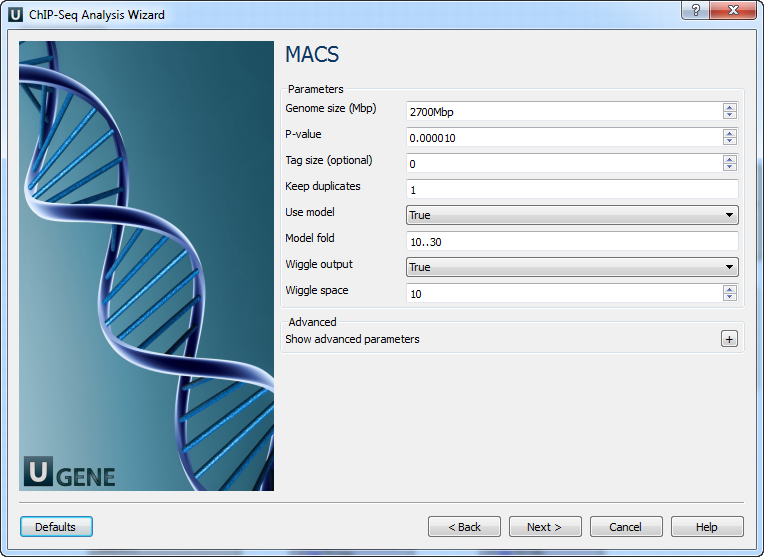
Page 2: MACS
MACS parameters:
| Parameter | Description |
|---|---|
| Genome size | e.g., Human: 2,700 Mbp, Mouse: 1,870 Mbp, etc. |
| P-value | Default 0.00001. Looser: 0.001 |
| Tag size | Optional. Input 0 to auto-detect. |
| Keep duplicates | Options: auto, all, or number. |
| Use model | Use MACS paired peaks model. |
| Model fold | Fold range to build the paired peaks model. |
| Wiggle output | Store fragment pileup in wiggle format. |
| Wiggle space | Wiggle resolution (default: 10 bp). |
| Shift size | Used if no model; half of fragment size. |
| Band width | Scan width for model building. |
| Use lambda | Use local lambda model to reduce false positives. |
| Small nearby region | Region (bp) near peaks for local lambda. |
| Auto bimodal | Enable fallback to shift-size model if auto model fails. |
| Scale to large | Scale smaller sample up to match the larger one. |
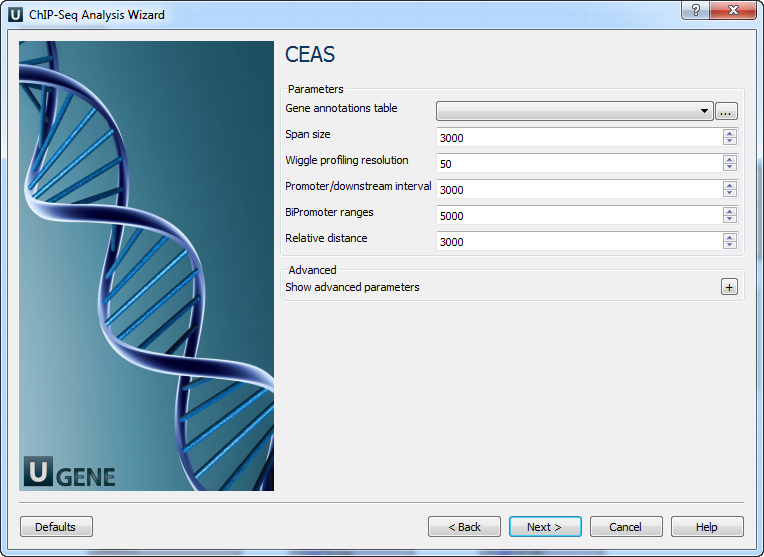
Page 3: CEAS
CEAS parameters:
| Parameter | Description |
|---|---|
| Gene annotations table | e.g., refGene table in SQLite format |
| Span size | TSS/TTS window for promoter/downstream (in bp) |
| Wiggle profiling resolution | Must be ≥ wiggle interval |
| Promoter intervals | 3 values or 1 (split into 3) |
| BiPromoter ranges | 2 values or 1 (split into 2) |
| Relative distance | To TSS/TTS in WIGGLE profiling |
| Gene group files | CSV with gene names in first column |
| Gene group names | Optional; comma-separated (e.g., Group 1,Group 2) |
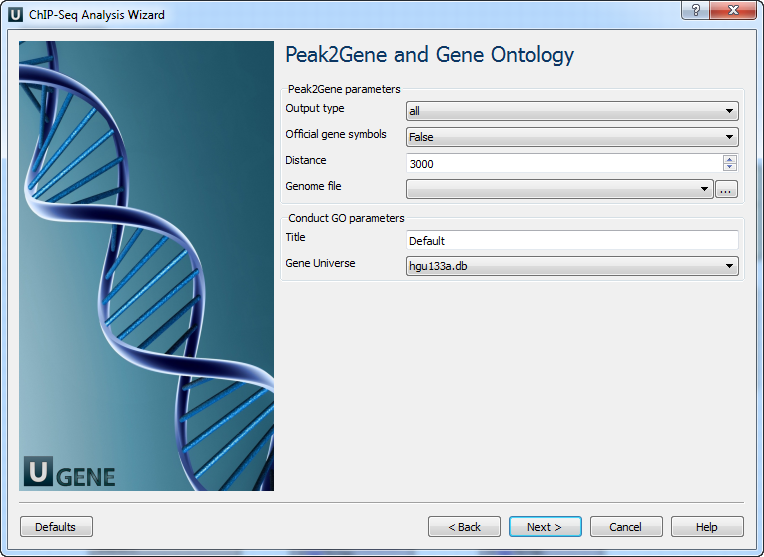
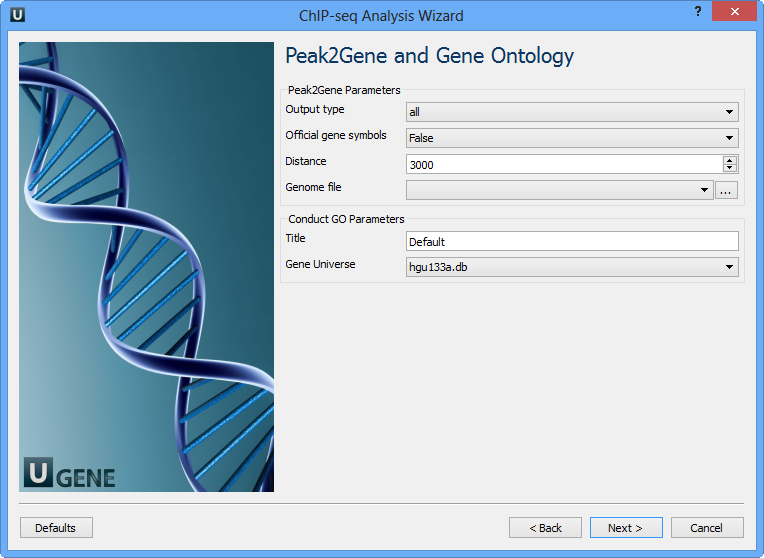
Page 4: Peak2Gene and GO
| Parameter | Description |
|---|---|
| Output type | Output directory |
| Official gene symbols | Output gene symbols instead of RefSeq |
| Distance | Radius (in bp) from peak center |
| Genome file | SQLite genome reference |
| Title | Used for output filenames |
| Gene universe | Define universe for GO analysis |
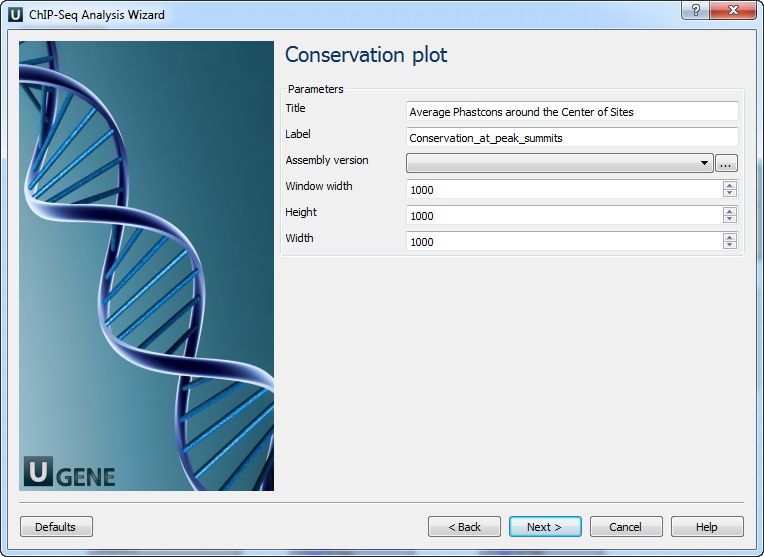
Page 5: Conservation Plot
| Parameter | Description |
|---|---|
| Title | Title of figure |
| Label | Label for data in figure |
| Assembly version | Directory for phastCons scores |
| Window width | Width around binding site (bp) |
| Height | Plot height |
| Width | Plot width |
Page 6: SeqPos Motif Tool
| Parameter | Description |
|---|---|
| Genome version | UCSC database version |
| De novo motifs | Enable/disable de novo motif search |
| Motif database | Known motif collection |
| Region width | Region width for scanning motifs |
| P-value cutoff | Significance threshold for motifs |
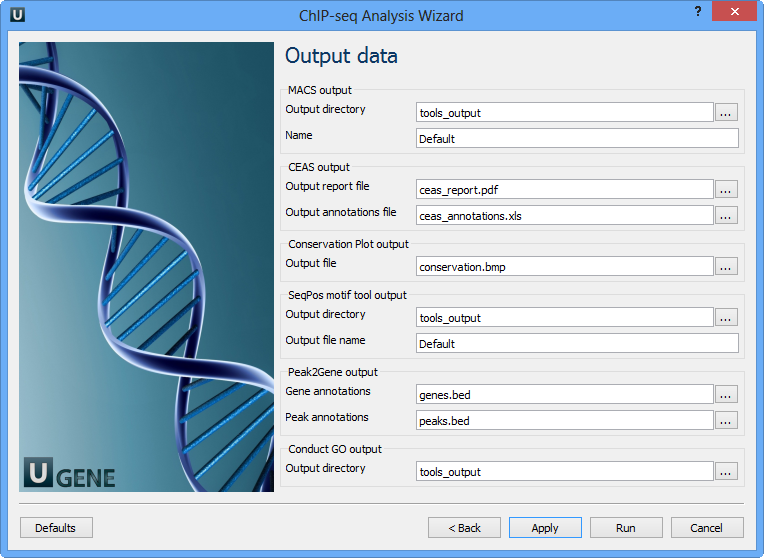
Page 7: Output Data
MACS output:
| Parameter | Description |
|---|---|
| Output directory | Folder for MACS output |
| Name | Prefix for output files (e.g., NAME_peaks.xls, NAME_peaks.bed, etc.) |
CEAS output:
| Parameter | Description |
|---|---|
| Output report file | CEAS result report |
| Output annotations file | Tab-delimited file per RefSeq gene |
Conservation Plot output:
| Parameter | Description |
|---|---|
| Output file | BMP image with phastCons scores |
SeqPos motif tool output:
| Parameter | Description |
|---|---|
| Output directory | Folder for results |
| Output file name | File storing de novo found motifs |
Peak2Gene output:
| Parameter | Description |
|---|---|
| Gene annotations | Output path for gene annotation data |
| Peak annotations | Output path for peak annotation data |
Conduct GO output:
| Parameter | Description |
|---|---|
| Output directory | Folder for GO analysis results |
The work on this pipeline was supported by grant RUB1-31097-NO-12 from NIAID.