
Tutorial: How to Build Dot Plot in UGENE
Dotplot plugin allows the graphical comparison of two biological sequences with identifying the regions of similarity. Today we will consider such a comparison and we are going to have a look at how UGENE dot plot maker works.
Setting Dot Plot Data
The opened project contains two sequences: the source and the mutated one. The mutation is created artificially to let me demonstrate you the Dotplot usage. To compare the sequences, I will drag one sequence object into the view of another, to create a multiple sequence view that will contain the sequences to compare. Now right click on the view and select „Analyse→Build Dotplot“.
The UGENE dot plot maker dialog has appeared. Let's place the source sequence at the horizontal x axis and the mutated sequence at the vertical y axis. I will keep the default dotplot build algorithm.
Dot Plot Maker Parameters
The remained options are repeat finding options. Minimum repeat length option is used to draw only such matches between the sequences that are continuous and long enough. Each case is individual, but selecting too small repeat length values can overburden the plot with the matches, and selecting too high values can filter useful details. To select the repeat length value corresponding to about one thousand results, simply click the „1k button“. Repeats identity value is 100% by default, but can be adjusted if needed.
The options are set and I press „OK“. The dotplot is built and displayed. I will close the unnecessary strands and views. <…> Every dot on the plot corresponds to a matched base symbol at the „x“ position of the „horizontal“ sequence and the „y“ position of the mutated sequence. The diagonal line indicates the match between the comparing sequences. I will zoom in the first matching region by pointing mouse cursor near it and rotating the mouse wheel. Then I select the regions area by simply clicking on the line. Note, that the corresponding selections were automatically made on all the connected sequence views. Now, looking at the details view we can see that the sequences match along the selected area.
Dot Plot Viewer
The nearby gap is a deletion from the source sequence, since the whole gap is located at the x-axis sequence, which is, in our case, the source sequence. A deletion is a kind of a dotplot frame shift. The deletion itself can be read from the details view. <…>
I will zoom out the plot. The next noticeable plots feature is this rectangle area filled with the matches. This is most likely a low-complexity region, id est a region produced by redundancy of a few amino-acids in a particular part of the sequence. By comparing a sequence with itself, you can search for such regions within the sequence. We see at the details view that the corresponding parts of the comparing sequences actually contain only redundant thymine (however usually it will be an amino-acid).
Moving further, we see this gap at the diagonal. This is another kind of a frame shift, a mutation. We can tell that by the distinction between the sequences along this region, and the sequences match out of this region.
The next plots feature is the last kind of a frame shift, an insertion. The whole gap is located at the y-axis sequence, which is the mutated one. This means that a subsequence was inserted into the source sequence.
That's what we can read from this particular dotplot. In UGENE it is possible to compare several dotplots. For instance, I can build another dotplot for sequences from the opened multiple sequence view. The second dotplot is built and displayed at the same view and ready to compare.
Now, I can save the dotplot as an image or in a native format, by right-
clicking at the view and selecting „Dotplot→Save/Load“ items. A dotplot, saved in a native format, can be loaded from the dot plot creator view.
Unnecessary dotplot views can be unloaded by selecting „Dotplot→Remove“
Note, that the parameters of the dot plot creator can be adjusted by activating „Dotplot→Parameters“ menu item.
Advance Usage
In conclusion, let's use the plugin with the real data. Let's do this by activating the „Tools→Build dotplot“ global program menu item. In the opened dialog box I will specify a chloroplast genome sequence as the first sequence, and another chloroplast genome sequence as the second sequence.
Note, that you can open files containing multiple sequences and then join them and use as one sequence to compare. To do this, check the „Join all sequences“ checkbox.
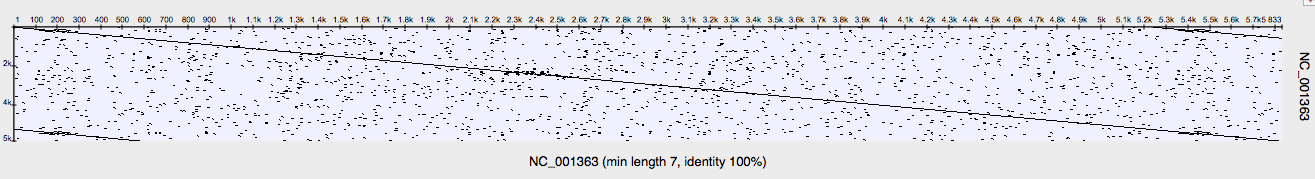
I press next and specify the parameters of the new dotplot, comparing the specified sequences. I will use the heuristic „1k results“ button and press „OK“. The dotplot is built and displayed. Please note, that the multiple sequence view for the selected sequences was opened automatically.
As we can see, the sequences match most of the times. The most noticeable regions here, besides the diagonal matches, are two big mutation regions, a mutation-and-insertion region (we are talking about an insertion into the horizontal sequence) and the big deletion region.
That's the way to build and use dotplots in UGENE.